|
Dealing with Skewed Variables |
|
|
||||||||||||||||||||||||||||||||||||||||||||||||||||||||||||||||||||||||||||||||||||||||||||||||||||||||||||||||||||||||||||||||||||||||||||||||||||||||||
|
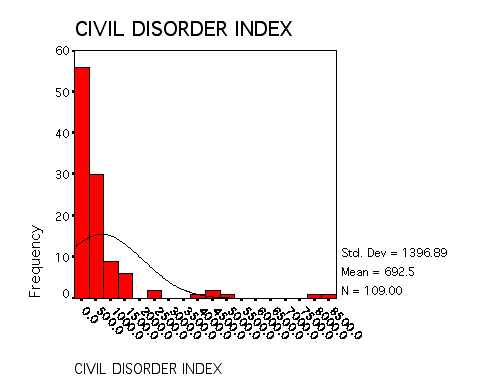
Using SPSS to compute the mininum and maximum values, you find that the minimum value for CIVILDOR is 2, and the maximum is 8470. That range suggests that the variable has a large standard deviation. You can learn how the values are distributed by running Frequencies (suppressing the Table); asking for Mean, Standard Deviation, Skewness, and Kurtosis; and producing a histogram.
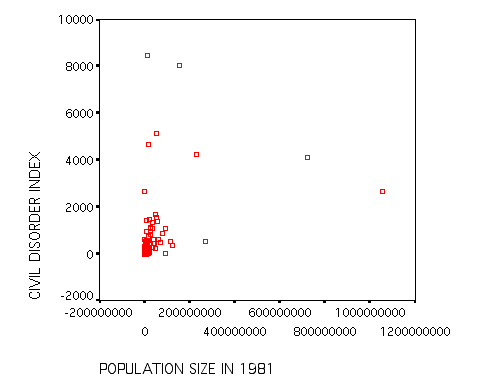
If values for CIVILDOR are total counts of incidents of civil disorder, populous countries would have more disorder by normal human aggression. That this is largely true is shown by the plot of CIVILDOR with POPULA70.
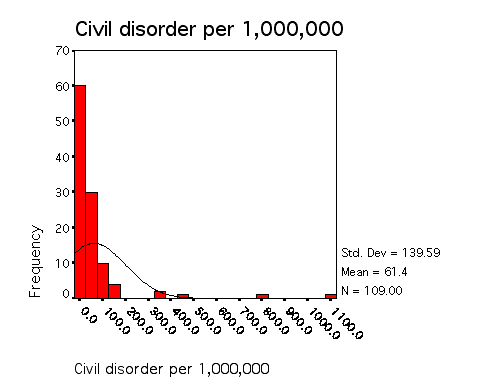
Seeing that incidents of civil disorder are influenced by size of population, you might compute a new variable based on incidents of civil disorder per 1,000,000 people according to this formula: You can then run the Frequencies procedure to examine the new distribution:
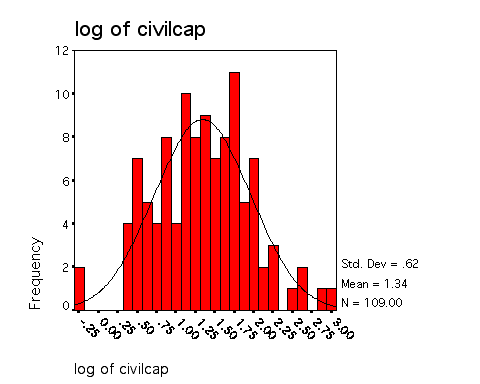
Dividing by population removed the influence of population in calculating civil disorder, but the resulting distribution was even more skewed to the right. Another technique for dealing with an extreme positively skewed distribution is to compute its logarithm--the exponent of the power to which another number, the base (in this case 10), must be raised to equal the original number. In substantive terms, this means that incidents of disorder in one nation must be ten times the incidents in another nation to separate the nations by a full unit of measurement. This transformation can be justified by an argument similar to that in economics about the diminishing utility of a dollar at high income levels. Similarly, computing the logarithm of CIVILDOR implies that different incidents of disorder between two nations do not "register" unless one rate is at least ten times the other. This approach to measurement is frequently used for many forms of political and social behavior. During the Korean and Vietnam wars, for examples, public opposition to U.S. involvement was linked more closely to the logarithm of battlefield casualties than to a simple count of casualties. (In the table below, only the integer characteristic is listed and not the decimal mantissa.)
The distribution of the logarithm of CIVILCAP is very close to normal. The following command will list the individual nations and the relevant variables to help evaluate our reworking of the CIVILDOR variable: COUNTRY CIVILDOR CIVILCAP CIVILLOG AFGHANISTAN 38 3.05 0.484 ALGERIA 4679 340.39 2.532 ANGOLA 541 91.14 1.96 ARGENTINA 1137 47.88 1.68 AUSTRALIA 113 9.03 0.956 AUSTRIA 110 14.81 1.171 BANGLADESH 41 0.6 -0.22 BELGIUM 229 23.72 1.375 BOLIVIA 468 108.21 2.034 BRAZIL 364 3.8 0.58 BULGARIA 22 2.59 0.414 BURMA 1357 50.26 1.701 CAMEROON 142 20.94 1.321 CANADA 260 12.19 1.086 CENTR.AFRICAN REPUBLIC 99.99 . . CHAD 52 14.27 1.155 CHILE 297 31.7 1.501 CHINA 2662 3.17 0.501 COLOMBIA 833 39.17 1.593 |
||||||||||||||||||||||||||||||||||||||||||||||||||||||||||||||||||||||||||||||||||||||||||||||||||||||||||||||||||||||||||||||||||||||||||||||||||||||||||